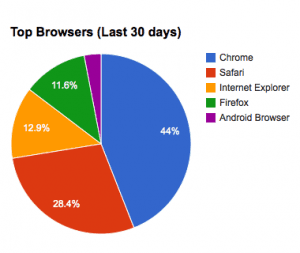
 FUN FACT: All of the reports shown below are embedded charts that update daily with new information! Don’t believe us? Just check back tomorrow to see if the information has changed.
Moving on… For the last several years we have spent countless hours entering data from tools like Google Analytics into spreadsheets. As we typically only allocate 2-5 hours per client to analyze reports and provide strategic recommendations, using 1-2 hours of that time just in data entry is not serving our clients to our full potential.
Enter Google Analytics’ Spreadsheet Add-On. This tool allows you to share data from analytics with a designated Google sheet and run reports either one at a time or schedule them to run at different time increments. Furthermore you can create separate tabs, graphs and your own calculations to display the most effective information for your reporting. If planned correctly, you can run virtually all your weekly, monthly or annual reporting without even logging into analytics or your spreadsheet, saving tons of time and letting you focus in on gleaming bigger picture insights and growing your business.
For more information on how to get started on a dashboard of your own, visit this Google help page or contact our team today to build one for you! Scroll down the page to view some of the charts/graphs shown in the tutorial as well as a few simple examples I’ve created myself.
Device Conversion Rate Report:
Device Conversion Rate Report:
